
Research does not stop after collecting data; there is another equally crucial phase to be completed in many studies, analyzing the collected data. Researchers might have a large number of observations, but without an appropriate analysis, these observations will never help answer the research question. That is why data analysis in research is crucial. Data analysis in research comprises organization, processing, investigation, and interpretation of collected data by means of appropriate statistical methods. According to the research design, types of data, samples, and demands for analysis, the researcher uses various programs for statistical analysis: SPSS, Python, or MATLAB.
Cho
That entire process forms an important part of research data analysis.
Why Is Data Analysis Important in Research?
Good data analysis for research assists researchers in transitioning from observation to informed conclusions. It is capable of revealing patterns which cannot necessarily be seen when analyzing data manually.
Data analysis is able to assist researchers by:
- Identify trends and relationships between variables
- Compare different groups or conditions
- Test research hypotheses
- Measure the strength of associations
- De
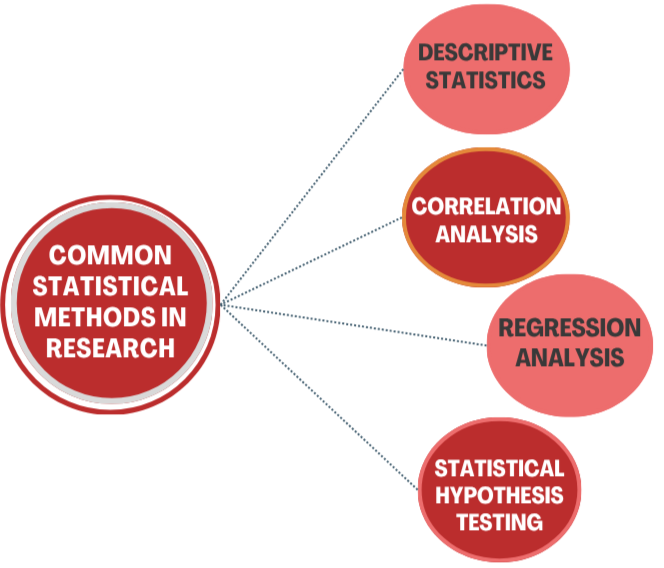
1. Descriptive Statistics
The descriptive statistics describe the collected data. Common measures include:
- Mean
- Median
- Mode
- Standard deviation
- Variance
- Range
- Percentages and frequencies
For instance, a researcher looking at patient waiting times could use mean and median as measures of central tendency and standard deviation for measuring variability of the values.
2. Correlation Analysis
Correlation analysis tests if there is any relationship between the two variables. For instance, a researcher may conduct a correlation analysis to test if there is any relationship between study time and examination results.
Common correlation measures include:
- Pearson correlation
- Spearman rank correlation
- Kendall's tau
A correlation, however, does not automatically establish causation. Two variables can be associated without one directly causing the other.
3. Regression Analysis
The analysis involves looking into how two or more variables relate to each other.
Examples include:
- Linear regression
- Multiple linear regression
- Logistic regression
- Polynomial regression
Regression enables researchers to determine the association between changes in independent variables and the dependent variable in the presence of other variables in the regression model.
4. Statistical Hypothesis Testing
Statistical hypothesis tests enable researchers to determine whether observed relationships or differences conform to a stated hypothesis.
Commonly used tests are:
- t-test
- Chi-squared test
- ANOVA
- Mann–Whitney U test
- Wilcoxon signed-rank test
- Kruskal–Wallis test
Selection of appropriate tests is a function of the nature of data and experimental design. Statistical tests should not be chosen solely based on their results.
SPSS Data Analysis: A Practical Choice for Many Researchers
SPSS data analysis is widely used in academic, medical, social science, behavioral, and market research. Its graphical interface allows researchers to perform many statistical procedures without writing extensive code.
What Makes SPSS Useful?
SPSS is particularly convenient when researchers need to:
- Import and organize datasets
- Generate descriptive statistics
- Create tables and charts
- Perform hypothesis tests
- Conduct correlation and regression analysis
- Analyze survey data
- Perform reliability analysis
- Manage categorical variables
For researchers that are not confident when it comes to programming skills, the process of SPSS for research may be easier to use than other methods.
The usual SPSS statistical analysis process would be importing the data set, assigning the variables, verifying the data set, selecting a proper statistical test, analyzing the output, and interpretation of the results.
But just by clicking a statistical test on SPSS does not automatically make your analysis valid.
Python Data Analysis: Flexible and Reproducible
In contrast to traditional point-and-click statistical software packages, Python is a programming language which provides numerous options for working with data.
The use of Python data analysis is especially efficient when scientists work with big or rapidly changing datasets.
Libraries such as:
- Pandas – Data manipulation and analysis
- NumPy – Numerical computing
- SciPy – Scientific and statistical computing
- Statsmodels – Statistical modelling
- Matplotlib and Seaborn – Data visualization
- Scikit-learn – Machine learning
Python statistical analysis allows the researcher to automate the repeated process and have the analysis code saved which details how the result was achieved.
For instance, instead of the researcher having to manually repeat the calculations on several datasets, he/she could write one Python code which would allow him/her to conduct the exact process with any other future dataset.
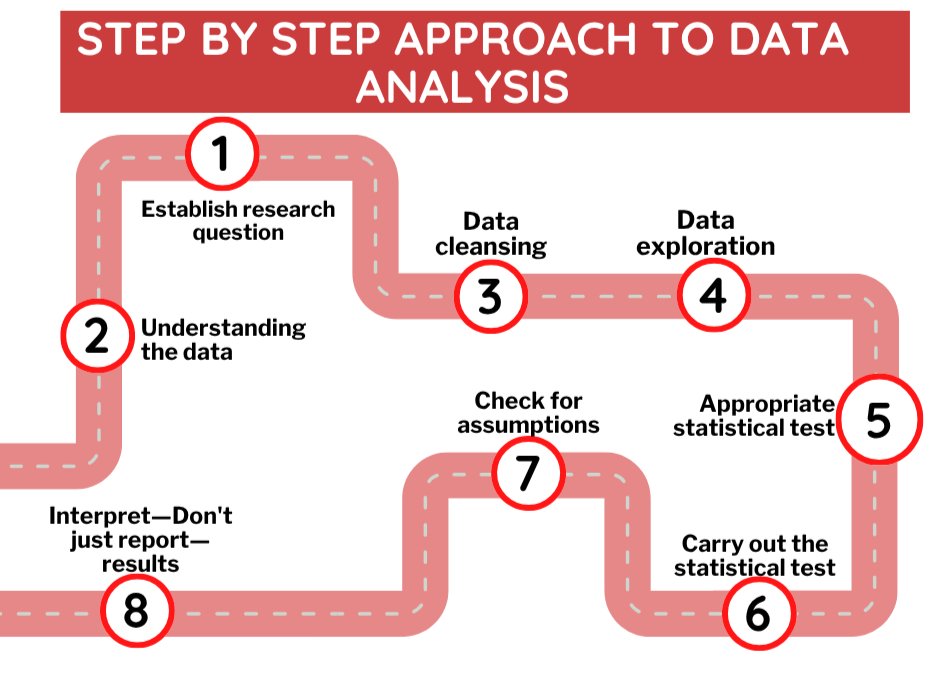
Step 1: Establish research question
Clearly define what information is required.
Step 2: Understanding the data
U
Step 7: Check for assumptions
Check for assumptions including independence, normality, homogeneity of variance, linear relationship or no multicollinearity problems depending on the analysis method used.
Step 8: Interpret—Don't just report—results
The p-value or coefficient is not the conclusion. Researchers should interpret results relative to the research question, recognizing uncertainty and limitations.
Common Mistakes to Avoid in Statistical Analysis
Even sophisticated software cannot correct a poorly designed analysis. Researchers should avoid:
- Selecting a statistical test without understanding its assumptions
- Running multiple tests simply to find a significant result
- Ignoring missing
Good statistical analysis for research requires methodological reasoning, not simply knowledge of software commands.
Final Thoughts
Data analysis in research is a process through which information turns into science. There will be no significant difference with regard to whether one uses SPSS, Python, or MATLAB, provided the approaches used are appropriate.
Use of the SPSS software can aid the researcher to have an easier process of analysis, while Python and MATLAB allow greater manipulation of data. Nevertheless, software cannot take the place of methodology and statistics.
The goal is not to produce more tables, graphs, or p-values. The goal is to extract reliable evidence from data and explain what that evidence actually tells us.
Frequently Asked Questions (FAQs)
1. What is data analysis in research?
Data analysis for research involves collecting, organizing, scrutinizing and interpreting data that is collected in an effort to find trends, prove hypotheses and make conclusions based on the study.
2. What is the best software to use in research data analysis?
It depends on the requirement of the research. SPSS is good for conducting traditional statistics and surveys, while Python allows flexibility and reproducibility. However, MATLAB is the software of choice for numeric computations and computational studies.